Application of 3D Cell Explorer to the Analysis of Single Cells
Yeast
S. cerevisiae is an excellent reference organism for biomedical research in investigating fundamental cellular processes. In spite of their small size, the cellular morphology and physiology of yeast cells can be successfully studied, thanks to microscopy techniques such as Indirect Immunofluorescence and Fluorescent Live Cell imaging.
Indirect immunofluorescence protocols for specific and homogenous staining are typically easily applied, but at the cost of nonviable cells and time‐consuming preparation of slides, which is prone to problems with fixation and permeability. On the other hand, setting up Live‐Cell, time‐lapse microscopy requires expensive equipment and labeling with organelle‐specific fluorescent dyes and expression can be critically dependent on the phase of yeast growth.
Nanolive’s technology seeks to bypass these limits, allowing for 3‐D live‐cell imaging without the need for chemical markers or genetic manipulation.
3D Cell Explorer allows for:
- Real-time acquisitions of budding (three‐hour time‐lapse, highest acquisition rate: 3‐D reconstruction in less than three seconds);
- Studying differences in bud and mother yeast (different composition, volume, refractive index, vacuole dimension etc.);
- Direct measurement of volume of cytoplasm and vacuole during growing or starvation or aging;
- Better morphological view of the yeast (localization of yeast and buds in three dimensions).
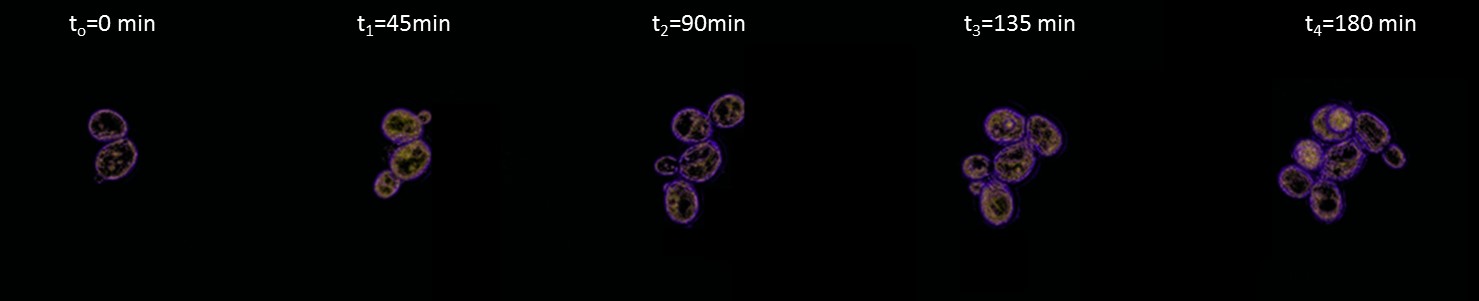
Budding Yeast: S. cerevisiae
S. cerevisiae strand (FRCs) was grown complete in Synthetic Complete Dextrose (“SCD”) medium in 35mm glass‐bottom culture dish (µ-Dish from ibidi GmbH). The time‐lapse imaging experiment was conducted at RT for 3 hours, capturing images every 30 seconds. The different components are digitally stained based on their specific Refractive Index (“RI”): membrane (purple), cythosol (yellow), vacuole (black).
Sperm Cells
Nanolive’s 3D Cell Explorer enables you to obtain super‐fast and accurate 4‐D reconstruction of living sperm cells.
It allows you to:
- Check the morphology of live sperm cells;
- Obtain quantitative information about internal components (head volume, amount of nucleic acid);
- Monitor the vitality of sperm cells;
- Evaluate structural and functional integrity of sperm cells.
Male reproductive health in both humans and animals is an important research field in biological study. While spermatozoa are essentially transparent and are almost invisible when observed in optical bright-field microscopy, they have a Refractive Index (“RI”) different from that of the surrounding medium. Based on this physical feature, Nanolive’s technology can be used as a label‐free, non‐invasive and high‐resolution tool for obtaining reliable and quantitative information about morphology and motility of sperm cells.
The 3D Cell Explorer enables you to monitor in 3‐D and real time the morphology, the motility and the concentration of the sperm cells, which are the most important parameters for infertility evaluation and In Vitro Fertilization (“IVF”) applications.
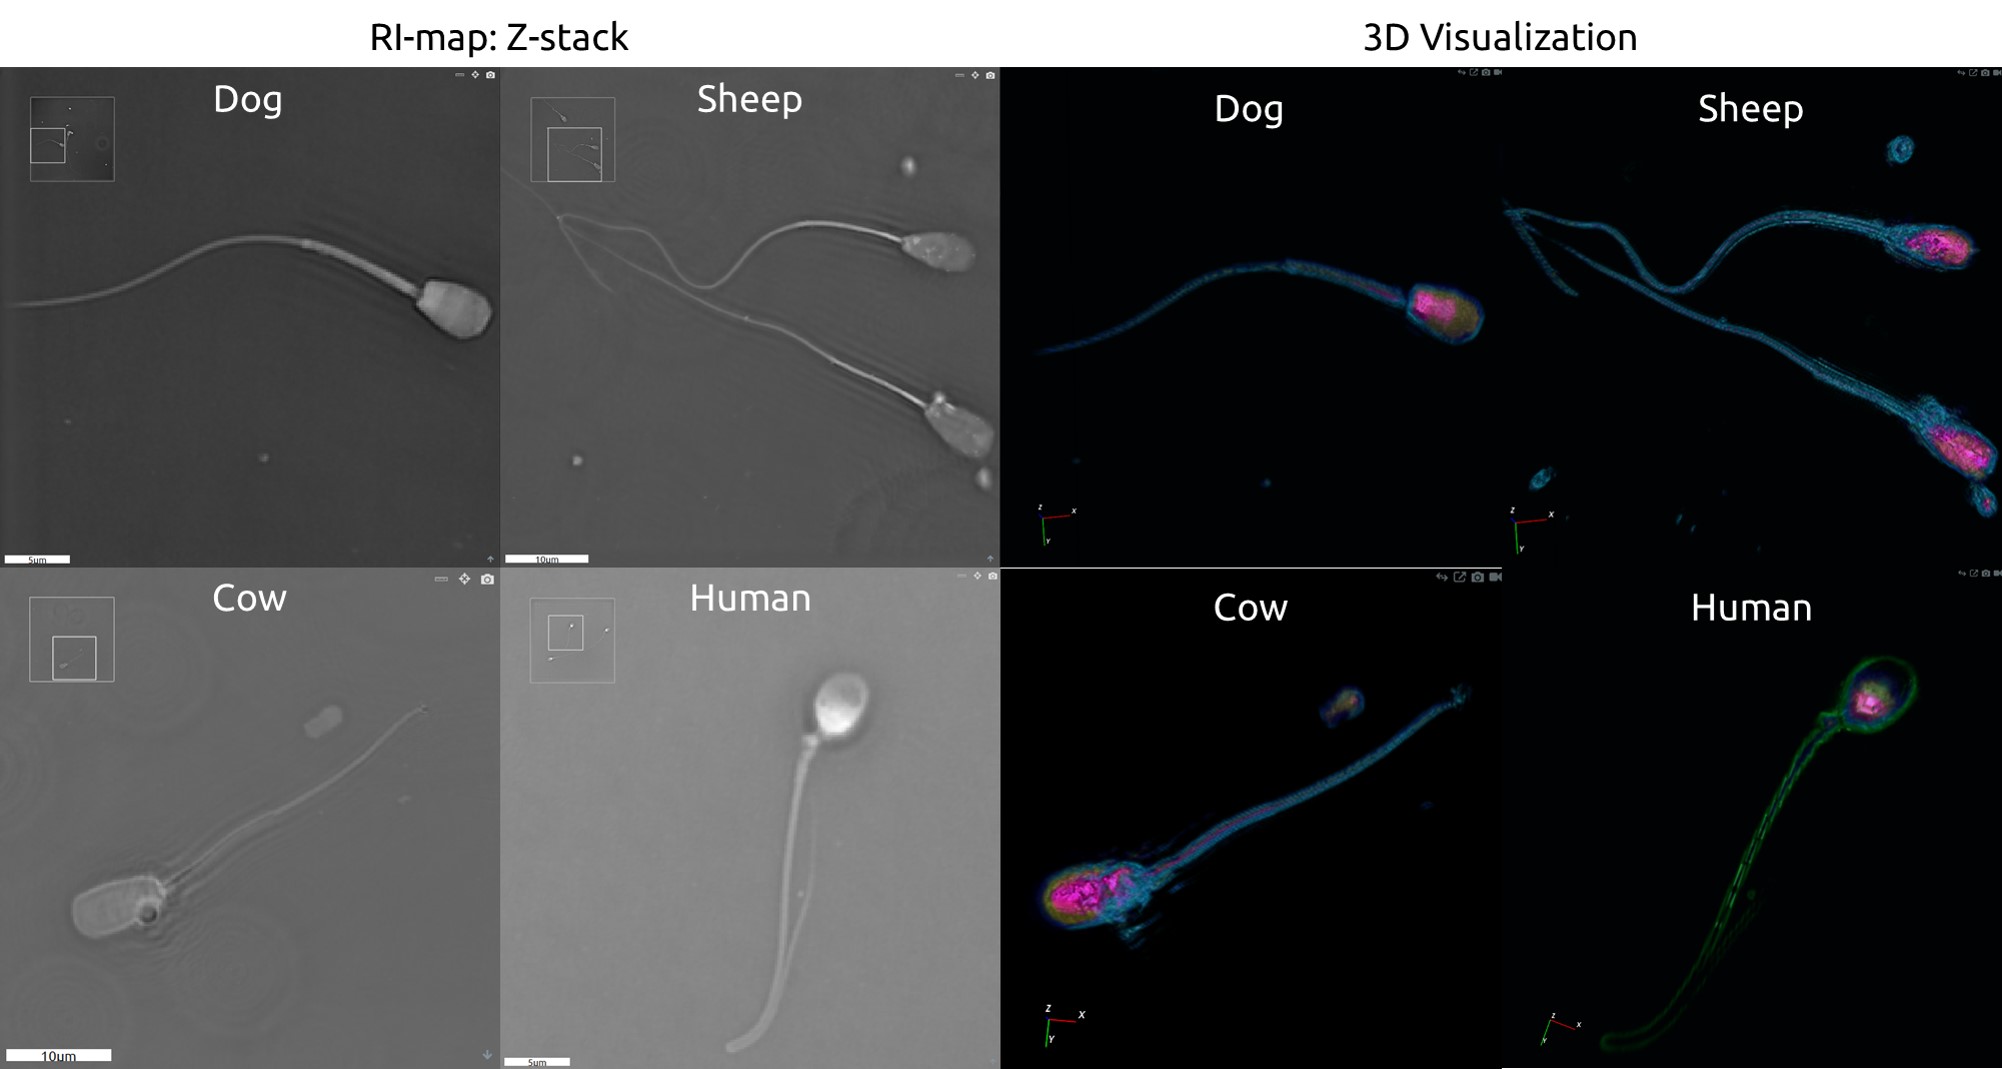
Human Sperm Cells
A fresh sample of human spermatic liquid was centrifuged and resuspended in PBS. The image was acquired in 2 seconds and without any kind of chemical staining, thanks to the 3D Cell Explorer. The different components of the sperm cell are digitally stained based on their specific Refractive Index: head (Red), genetic information (Yellow), vacuole (Light blue) and tail (Purple).
Intracellular Trafficking
Nanolive’s 3D Cell Explorer enables accurate and quantitative 4‐D spatio‐temporal monitoring of nano‐sized vesicular structures moving along the cytoskeleton network in living cells.
It allows you to:
- Discriminate vesicles and other cellular structures based on their specific refractive index, allowing for marker-free studies of this fascinating phenomenon;
- Monitor the distribution of intracellular vesicles over time;
- Localize, in 3‐D, their accumulation in regions of interest (ROI's).
A eukaryotic cell can be compared to a big city with several districts, each specialized in a particular role. For these districts to work properly in a coordinated manner, a complex infrastructure network of cargo modules (vesicles) and highways (communication) is needed. Throughout our cells, materials are continuously transported via membrane‐bound tiny packages called vesicles. These vesicles are delivered to specific intracellular locations by attaching them to molecular motors which haul them along cytoskeleton components, such as microtubules or actin filaments. This process is called intracellular trafficking and is crucial for the normal functioning of cells. Any defects in its regulation may cause various diseases: metabolic failures, neurodegenerative diseases such as Alzheimer’s or Parkinson’s diseases, and many senile genetic disorders.
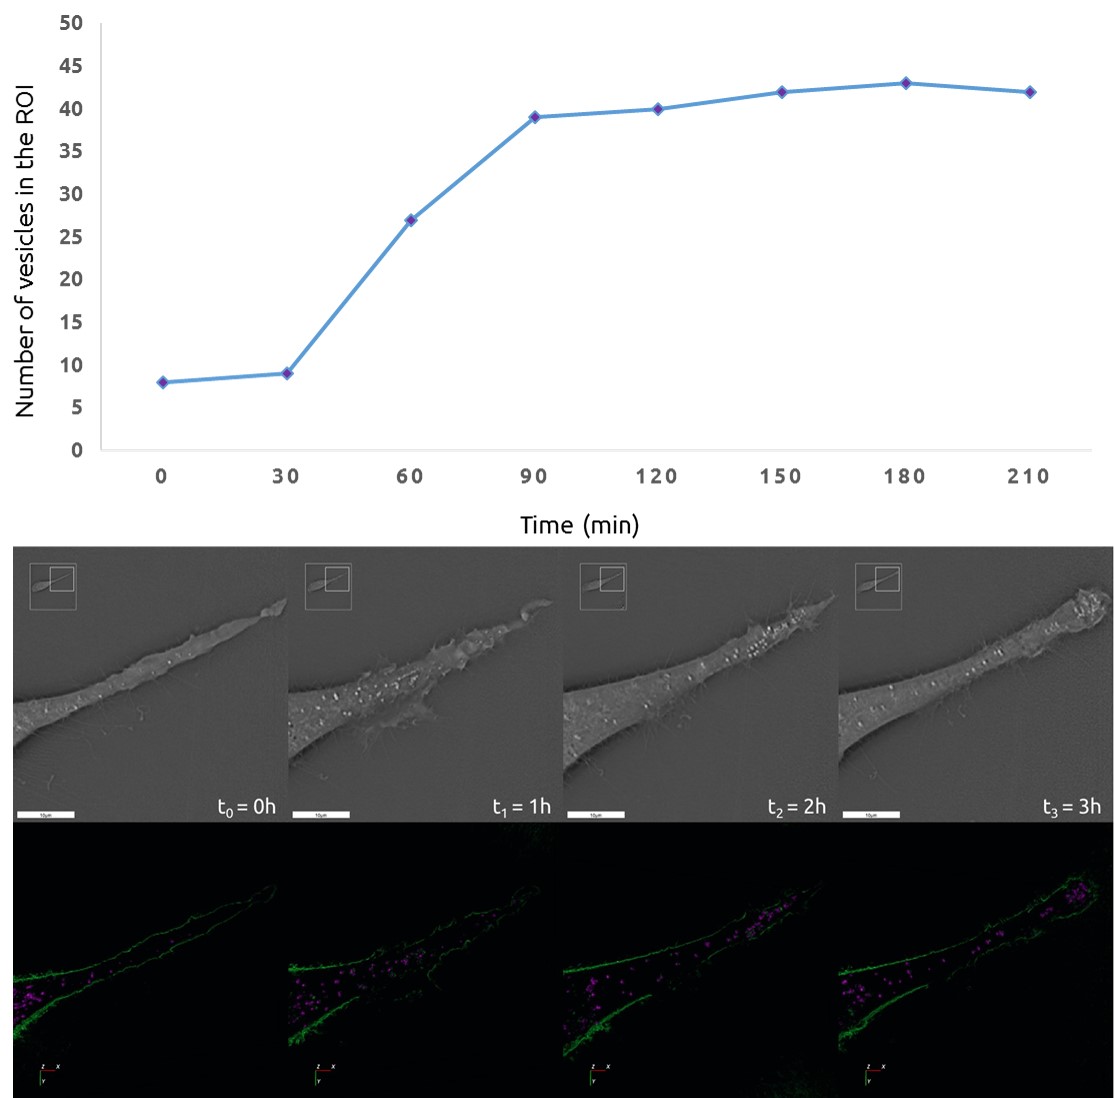
Intracellcular Vesicular Trafficking in Cancer Cells
Mouse skin melanoma cancer cells (B16, p35) were grown to 40% confluency in complete DMEM medium (Dulbecco’s Modified Eagle Medium) in 35mm glass‐bottom culture dishes (FluoroDishes™ WPI, #FD35-100). The time‐lapse imaging experiment was conducted with a standard top‐stage incubator set to 37°C and 5% CO2 for 8 hours, capturing images every minute.
Bacteria
Nanolive’s 3D Cell Explorer enables accurate and quantitative 4‐D spatio‐temporal monitoring of bacteria cultures.
It allows you to:
- Monitor several E. coli bacteria colonies growing into 3‐D systems stain‐free (e.g. alginate beads);
- Monitor the volume of a single bacterium or of a growing bacteria colony;
- Image and discriminate multi‐layers of bacteria totally stain‐free.
Bacteria are tiny, single-cell microorganisms, usually just a few micrometers in length. They may have different shapes, generally spherical (cocci), rod shaped (bacilli) or spiral. Although most bacteria are harmless, several are pathogenic and can cause life threatening diseases such as tuberculosis, tetanus and pneumonia. Other bacteria are instead beneficial and live in symbiosis with other organisms. A typical example is the gut flora. It consists of a complex community of bacteria and other microorganisms that live in the digestive tracts of animals and insects, assisting in digestion.
Nanolive’s new technology, the 3D Cell Explorer, allows you to observe bacteria as they are, alive and in real-time without the need of chemicals to stain them.
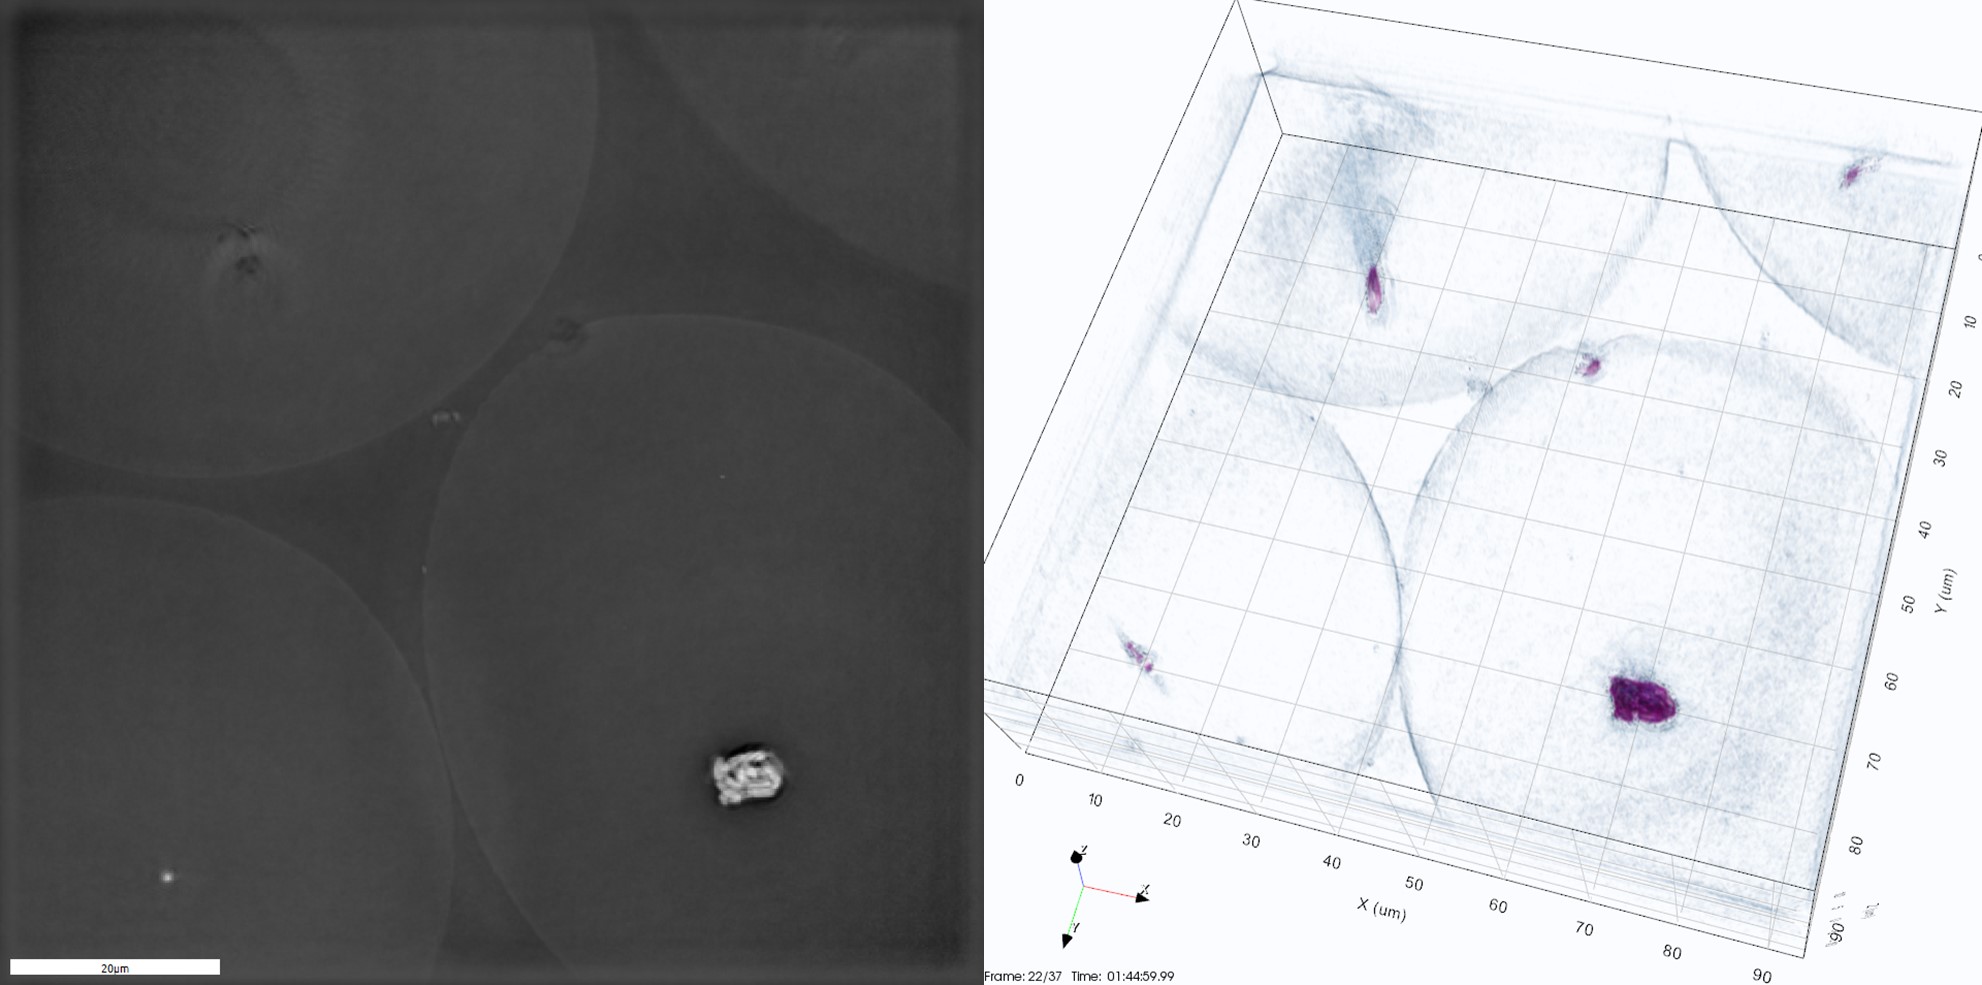
E. coli Embedded in Alginate Beads
Bacteria Growing in Alginate Beads
E. coli bacteria embedded in alginate beads of diameter 40–70 microns generated by Var J30 Encapsulation Unit, (Nisco Engineering AG, Zurich). The beads were mounted on a slide into Minimum Media (MM) diluted 1:4 with distilled water (plus 1% v/v Fumarate 100mM) . The time‐lapse imaging experiment was conducted with a standard top-stage incubator set to 37°C and 90% humidity for 3 hours, capturing images every 10 minutes.
Image courtesy of prof. Van Der Meer Jan Roelof (Département de Microbiologie Fondamentale, UNIL, Lausanne, Switzerland).
Multi‐layer E. coli
Multi-layer E. coli bacteria
E. coli bacteria (grown overnight in LB medium) were centrifuged (8000g for 20 minutes) in a tube. The pellet was split between a microscopy slide and the coverslip creating a multi-level bacteria in PBS.
E. coli Bacteria
E. coli bacteria
E. coli cells were seeded in agar (80% confluency) on coverslips and mounted on a glass slide.
Image courtesy of K. C. Huang lab, Stanford University
Bee Gut Microbiota
Bee Gut Microbiota
Fixed (ethanol) and embedded in paraffin, Honey bee gut tissue was sectioned using a microtome (5 micrometer thickness). At the end the slides were deparaffinized (xylene and ethanol). We observe the cells of the gut epithelial surface and the bacteria in the lumen. Multiple images were stitched together to obtain a 400×400 micrometer view of the whole tissue section.
Nanolive SA wishes to thank Professor Philippe Engel and the research unit at the Department of Fundamental Microbiology from the University of Lausanne (Switzerland), for the kind donation of the fixed bee gut sections used to produce this video.
Bacteria and Yeast Co-contamination
Bacteria and Yeast co-contamination
Fixed (4% PFA) HeLa cells stored at 4°C were contaminated by wild bacteria and yeast.
Based on their specific Refractive Index (“RI”), STEVE’s digital staining is able to distinguish between the biological contaminants, providing an automatic segmentation of the two different yeast strains on the culture.
Cell Death
Nanolive’s 3D Cell Explorer allows you to:
- Monitor the three major processes of cell death: apoptosis, necrosis and autophagy — all stain-free
- Assess morphological changes associated with cell death without any stain or sample preparation.
Cell death is the event of a cell ceasing to carry out its functions. Programmed cell deaths (“PCD”), such as apoptosis and autophagy, are a controlled process that confers advantages during an organism’s life cycle. They are involved in a variety of biological events, including morphogenesis, maintenance of tissue homeostasis, and elimination of harmful cells. Malfunctioning of PCD leads to various diseases in humans, including cancer and several degenerative diseases. Necrosis, in contrast, is caused by factors external to the cell or tissue, such as infection, toxins, or trauma, which result in the unregulated destruction of cell components.
Nanolive’s new technology, the 3D Cell Explorer, allows us to observe those processes in 3‐D, in real time and in a non‐invasive manner.
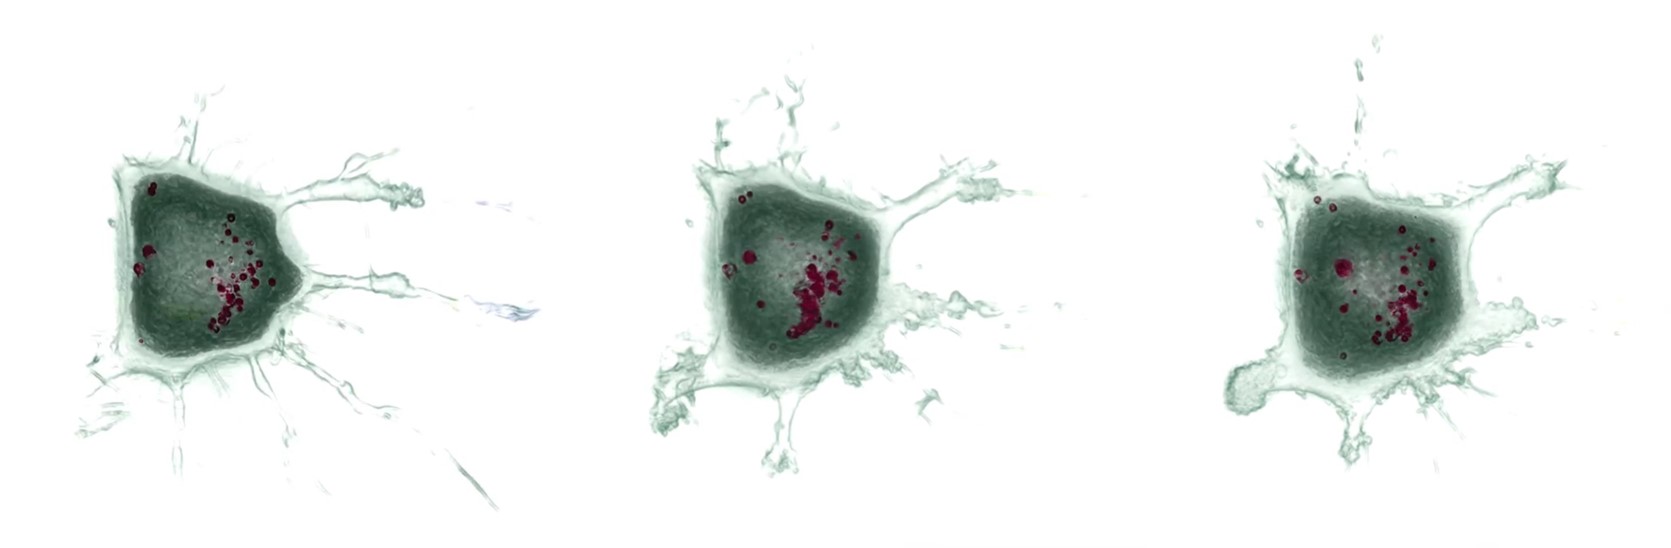
Necrosis of Mouse Melanoma Cancer Cells (B16)
Necrosis of Mouse Melanoma Cancer Cells (B16)
Mouse melanoma cancer cells (B16, p23) grown in complete DMEM medium (Dulbecco’s Modified Eagle Medium) in 35mm glass‐bottom culture dishes (FluoroDishes™ WPI, #FD35-100). The time‐lapse imaging experiment was conducted with a standard top-stage incubator set to 37°C and 5% CO2 for 8 hours, capturing images every 1 minute.
Apoptosis of Fibroblastic Reticular Cells
Apoptosis of Fibroblastic Reticular Cells
Fibroblastic Reticular Cells (“FRC’s”) grown to ˞80% confluency in complete DMEM medium (Dulbecco’s Modified Eagle Medium) in 35mm glass bottom culture dishes (FluoroDishes™ WPI, #FD35-100). The time-lapse imaging experiment was conducted with a standard top-stage incubator set to 37°C and 5% CO2 for 3 hours 40 minutes, capturing images every 30 seconds.
Cell Migration Analysis
Nanolive’s 3D Cell Explorer enables you to perform accurate and quantitative 4‐D spatio‐temporal monitoring of nano‐sized vesicular structures moving along the cytoskeleton network in living cells.
It allows you to:
- Track cell migration over time;
- Measure cell speed;
- Monitor morphological changes in cells during migration;
- Measure cell properties during migration (adhering surface, volume, thickness, and more).
Cell migration is essential for the proper development and maintenance of multicellular organisms. Tissue formation during embryonic development, wound healing and immune responses all require the coordinated movement of cells. Errors during this process can have serious consequences, including vascular disease, tumor formation and metastasis. An understanding of the mechanism by which cells migrate may lead to the development of novel therapeutic strategies for the well-being of humankind.
The 3D Cell Explorer allows for real-time and non-invasive cell migration monitoring in 3-D. With the 3D Cell Explorer you can measure chemotaxis related migratory responses, effects of cytoskeletal abnormalities on cell migration patterns, quantitative tracking of cells of interest during time, and more.
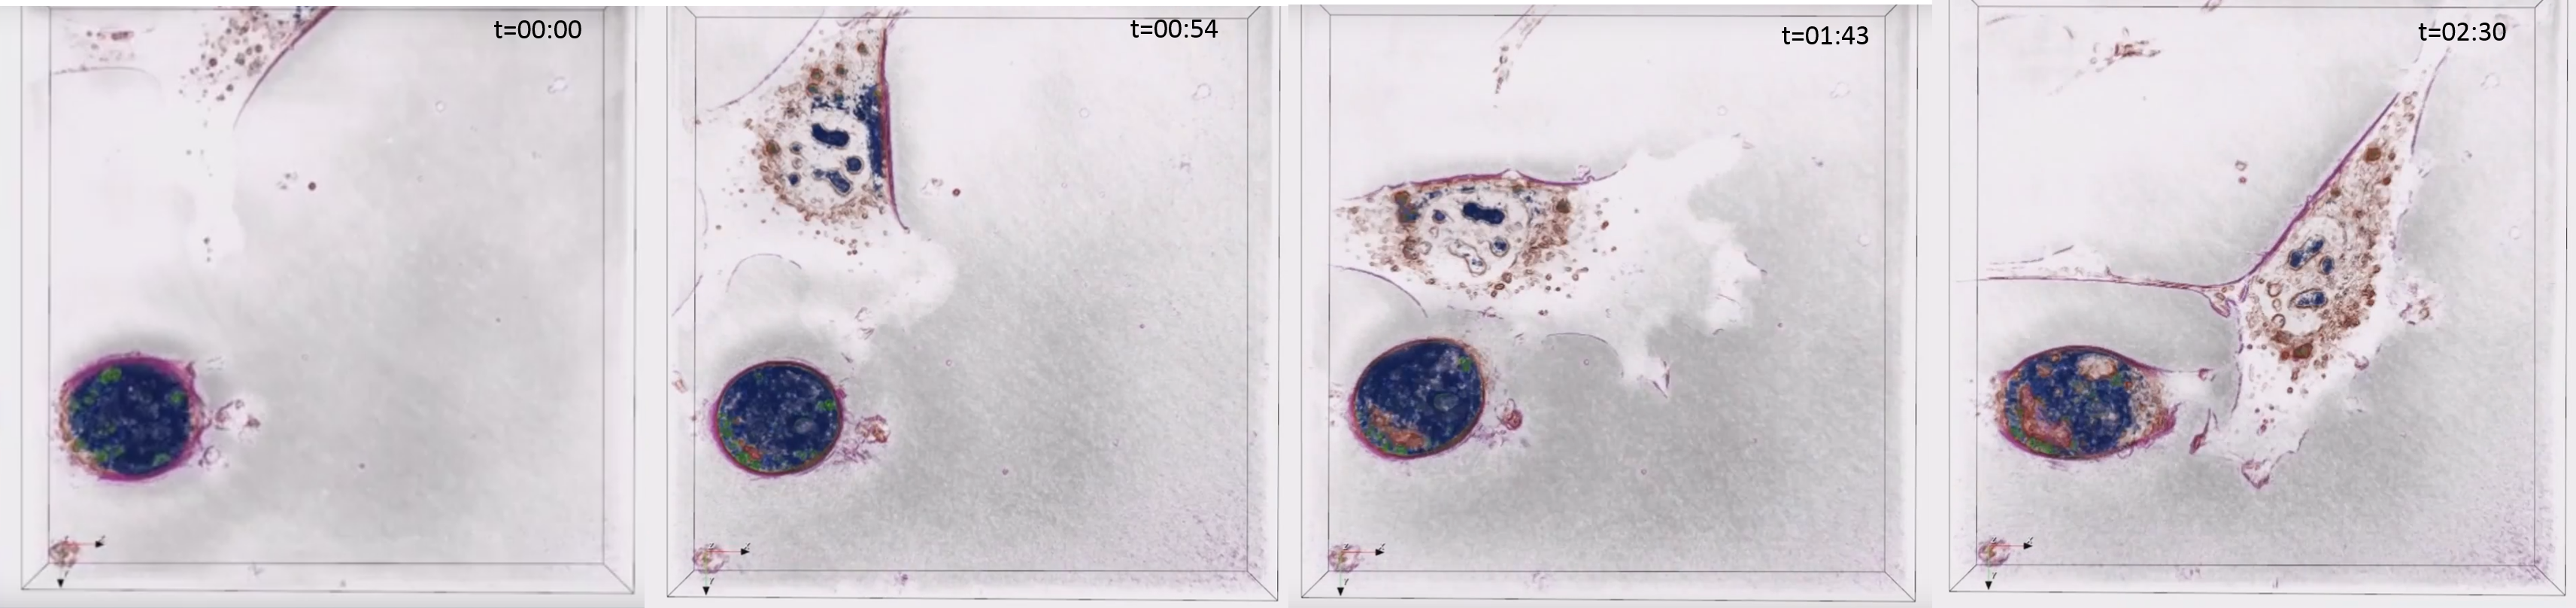
Mouse Fibroblastic Reticular Cell (“FRC”) Migration
Mouse Fibroblastic Reticular Cell Migration
Fibroblastic Reticular Cells (FRC’s) were grown to 40% confluency in complete DMEM medium (Dulbecco’s Modified Eagle Medium) in 35mm glass‐bottom culture dishes (FluoroDishes™ WPI, #FD35-100).
The time‐lapse imaging experiment was conducted with a standard top‐stage incubator set to 37°C and 5% CO2 for 2 hours 54 minutes, capturing images every 30 seconds.
Human Monocyte Migration among Red Blood Cells (“RBC’s”)
Human Monocyte Migration among Red Blood Cells
A sample of human blood was taken from a donor, smeared on a coverslip and imaged every 30 seconds at room temperature.
Amoeba Migration and Hunting
Amoeba Migration and Hunting
Amoeba cells from Prof. Pierre Cosson (Department of Cell Physiology and Metabolism, University of Geneva Medical School) and Dr. Samuel Lord (Department of Cellular and Molecular Pharmacology, HHMI, University of California, San Francisco) were imaged every 1.7 seconds in HL5 medium.
Cell Division Analysis
Nanolive’s 3D Cell Explorer enables you to perform accurate and quantitative 4‐D spatio‐temporal monitoring of nano‐sized vesicular structures moving along the cytoskeleton network in living cells.
It allows for:
- Label‐free 3‐D cell cycle analysis;
- Correlation of morphological changes to the cell cycle;
- Measurement of cell cycle duration time;
- Measurement of distribution of cell cycle phase in a cell population;
- Detection of cell cycle anomalies;
- Volume measurements of sub‐cellular parts during the cell cycle.
The cell cycle is a fundamental process for mammalian cell growth and development. It is composed of an ordered series of events which describes the intervals of cell growth, DNA replication, and mitosis preceding cell division. Errors in mitosis causing the incorrect replication of DNA can result in deadly consequences for the organism, depending on the amount and type of errors. Cancer is an example of a pathology caused by harmful mutations which are multiplied by mitosis.
The 3D Cell Explorer allows for real‐time and non‐invasive cell cycle monitoring. It detects the refractive indices, in 3‐D, of each and every cell organelle, to a precision higher than 0.001, and with unprecedented nanometer resolution (Resolution in X and Y is 200 nm; in Z, it is 400 nm). It can monitor changes in cellular refractive index, shape and size, during the cell cycle and mitosis (e.g. DNA condensation).
Mouse Fibroblastic Reticular Cell (“FRC”) Mitosis
Mouse Fibroblastic Reticular Cell Mitosis
Fibroblastic Reticular Cells (FRCs) were grown to 60% confluency in complete DMEM medium (Dulbecco’s Modified Eagle Medium) in 35mm glass‐bottom culture dishes (FluoroDishes™ WPI, #FD35-100).
The time‐lapse imaging experiment was conducted with a standard top‐stage incubator set to 37°C and 5% CO2 for 45 minutes, capturing images every 30 seconds.
Mitosis of Mouse Embryonic Stem Cells (“ESC’s”)
Mitosis of Mouse Embryonic Stem Cells
Mouse Embryonic Stem Cells (mESC’s) grown to 60% confluency in complete DMEM medium (Dulbecco’s Modified Eagle Medium) in 35mm glass bottom culture dishes (FluoroDishes™ WPI, #FD35-100).
The time‐lapse imaging experiment was conducted with a standard top‐stage incubator set to 37°C and 5% CO2 for 5 hours minutes, capturing images every minute.
Multi-layer of FRC cells and Mitosis
Multi-layer of FRC cells and Mitosis
p53 Knockout Fibroblastic Reticular Cells (“FRC’s”) were cultured to over 100% confluency, where the cells grew on top of one another, in complete DMEM medium (Dulbecco’s Modified Eagle Medium) in 35mm glass‐bottom culture dishes (FluoroDishes™ WPI, #FD35-100).
The time‐lapse imaging experiment was conducted with a standard stage‐top incubator set to 37°C and 5% CO2 for 3h 40 minutes, capturing images every 30 seconds.
Cell Cycle Anomalies Detection: Multipolar Mitosis
Cell Cycle Anomalies Detection: Multipolar Mitosis
Fibroblastic Reticular Cells (FRCs) grown to 80% confluency in complete DMEM medium (Dulbecco’s Modified Eagle Medium) in 35mm glass‐bottom culture dishes (FluoroDishes™ WPI, #FD35-100).
The time-lapse imaging experiment was conducted with a standard top-stage incubator set to 37°C and 5% CO2 for 3hours 40 minutes capturing images every 30 seconds.
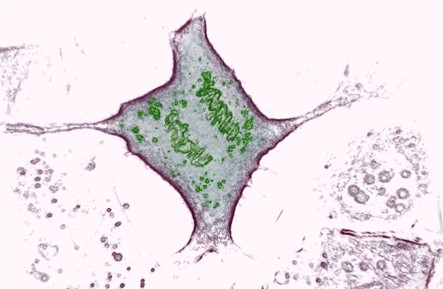
Monitoring of DNA Refractive Index Changes During Mitosis
Monitoring of DNA Refractive Index Changes During Mitosis
The refractive index of the DNA changes during mitosis. The 3D Cell Explorer is able to discriminate different mitotic phases based on these chromatin refractive index changes.
If you are interested in receiving the digital staining panel used in this video, please feel free to contact us!
Monitoring of Cell Thickness During Mitosis
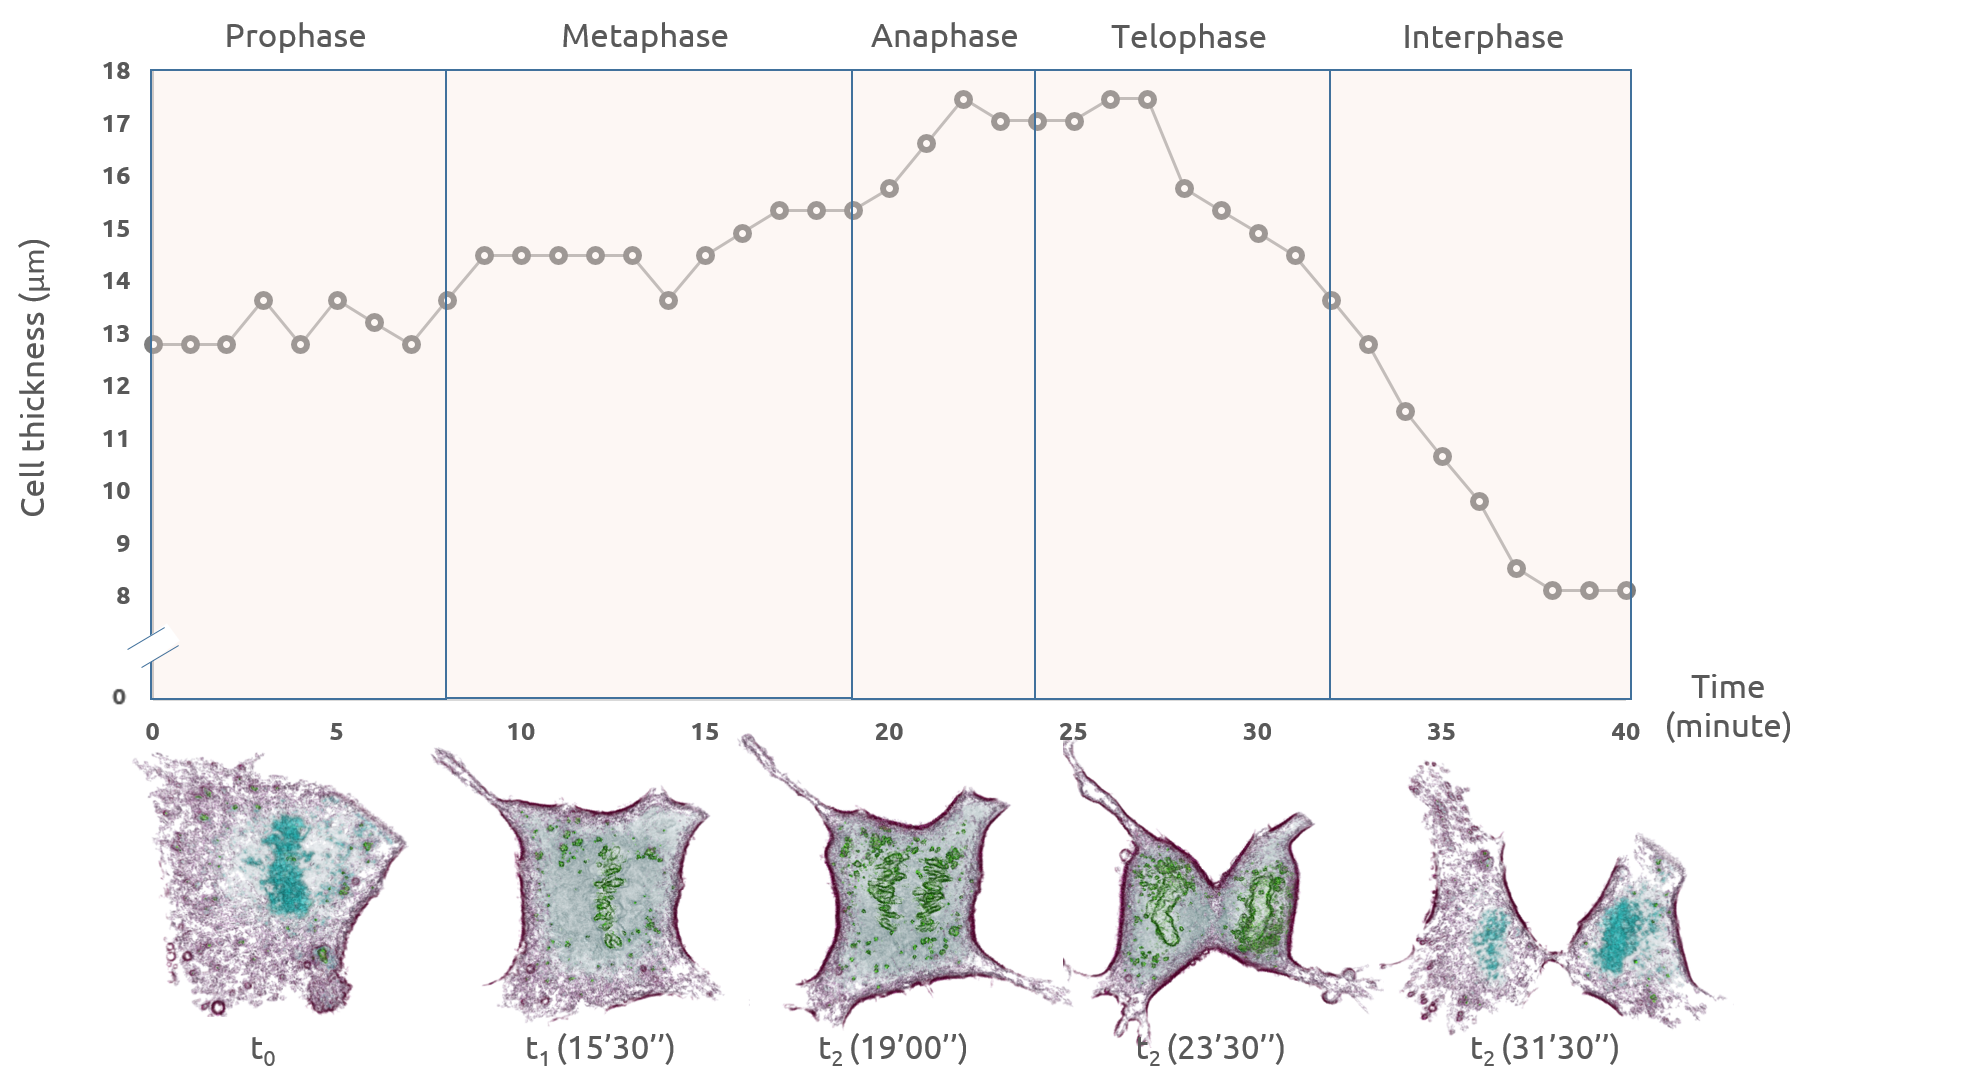
In the chart above, a mitotic cell was analyzed starting from prophase. The cell became progressively rounder and thicker while detaching from the bottom of the dish during the first mitotic phases and reaching a peak of 17.5 µm during the transition between anaphase and telophase. Later on, after the genetic material is segregated and the final cytokinesis takes place, the cell reattaches to the bottom of the culture dish and its thickness decreases to 8 µm. A new interphase is starting.